
![]()
Executive Summary
The Michigan Legislature has before it a package of bills that would allow all Michigan residents—including undocumented immigrants and those who cannot prove their legal presence—the opportunity to obtain a driver’s license or state identification card. The Drive SAFE (Safety, Access, Freedom and the Economy) bills,1 introduced by Senators Stephanie Chang (D-Detroit) and Winnie Brinks (D-Grand Rapids), along with Representatives Alex Garza (D-Taylor) and Rachel Hood (D-Grand Rapids), would bring Michigan law up to speed with that of 14 other states2 that allow residents who meet all other requirements to obtain a driver’s license.
Until 2008, all Michiganders had the ability to obtain a driver’s license after passing a driver’s test and meeting other requirements. After 2005, many states amended their driver’s license laws following the REAL ID Act, which established standards for driver’s licenses and documents used for federal purposes (like boarding a plane in the United States). In late 2007, Michigan Attorney General Mike Cox issued an opinion that stated undocumented immigrants in Michigan should not be considered residents and therefore were not eligible for driver’s licenses.3 In 2008, the Secretary of State complied with the opinion and the state Legislature codified this opinion into law.
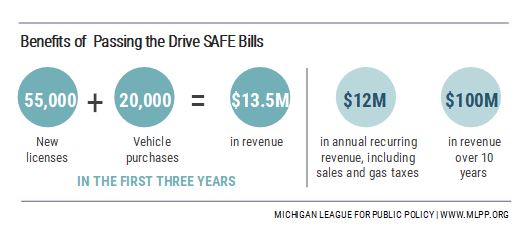
If the Drive SAFE legislation were to become law, the Michigan League for Public Policy estimates that over the course of three years, 55,000 Michiganders would apply for a driver’s license, leading to 20,000 vehicle purchases. Reinstating driver’s licenses for undocumented immigrants would boost state revenue by $13.5 million and contribute $12 million in recurring revenue, $9 million of which would be from sales and gas taxes related to vehicle ownership. Over the course of 10 years, this policy would generate nearly $100 million for the state of Michigan. This revenue would offset Secretary of State costs for staffing, including training and translation services.4 Additional benefits of this legislation include:
- 20,000 more Michigan drivers would be insured and have passed driver’s tests. To register a passenger vehicle in Michigan, one must have auto insurance. Roads are safer and accidents are resolved more smoothly when more drivers have passed a standardized driving test and are insured.
- Michiganders would see their annual auto insurance premiums go down by approximately $20. When more drivers are insured, everyone’s cost of auto insurance decreases. Across the country, states that allow undocumented immigrants to apply for driver’s licenses see lower annual premiums; doing so in Michigan would save Michiganders about $20 a year. Although this is a modest decrease, that is enough to pay for a car wash in the thick of Michigan winter!
 55,000 more Michiganders would be able to accomplish everyday activities more easily and with dignity. Our undocumented neighbors are business owners, parents, employees and caregivers. Allowing access to a driver’s license means that those who do obtain one can engage in their communities, participate in our state economy more fully and complete everyday tasks without fear.
- More residents would participate in Michigan’s local economy. Allowing undocumented immigrants to apply for driver’s licenses would support Michigan’s booming agricultural industry. In addition, access to a driver’s license means access to amenities and opportunities beyond one’s immediate community, including new businesses and higher-paying jobs.
Uptake and Increased Revenue
Within three years of implementation, an estimated 55,000 of the 110,000 Michigan residents who cannot prove their legal presence and are of driving age would apply for a driver’s license.5 These new licenses would bring in $1.4 million in fees to the state over this time frame.
Among those newly eligible to obtain a driver’s license, an estimated 20,000 people would purchase a car. Vehicle registrations, titles and license plates would generate $3 million over the course of the first three years of implementation. Annual vehicle registrations for these newly registered vehicles would generate $2.7 million each year.
Sales and gas taxes would increase by $1.6 million and $7.5 million, respectively, in the first three years of implementation. These estimates are recurring revenues based on individual-level consumption for the average driver in Michigan. Although sales taxes on car-related purchases may shift spending from other types of goods and services, this estimate only considers additional spending on motor vehicles and parts and does not take into account additional spending based on increased mobility or wages. Over a 10-year period, changes implemented through the Drive SAFE bills would generate nearly $100 million in revenue for the state of Michigan.
Public Safety
Under current law, accomplishing daily tasks while unlicensed is dangerous not only for drivers but for everyone on the road. Over a two-year period, the AAA Foundation for Traffic Safety found that one in five fatal crashes involved an unlicensed or invalidly licensed driver.6 In addition, AAA found that while most drivers did not leave the scene of a crash, unlicensed drivers did so nearly 10 times more often compared with validly licensed drivers. Analysis of a decade’s worth of pedestrian-motor vehicle fatal crashes exemplifies this behavior, revealing that an invalid license was a leading factor associated with a hit-and-run specifically.7 Therefore, removing this incentive for some drivers to flee will likely decrease hit-and-runs in Michigan. What’s more, research on this issue has demonstrated that undocumented immigrants across states are already careful drivers—and are even safer drivers in states that allow them to obtain a license.8 Data from California substantiates this trend: after allowing undocumented immigrants to obtain driver’s licenses, county rates of collisions remained constant, yet the rate of hit-and-run crashes decreased after the law was changed to allow everyone access to a driver’s license.9 The collective safety of our Michigan roads would only improve if undocumented immigrants were allowed to pass a driver’s test, obtain a license and have auto insurance.
 Auto Insurance premiums
In addition to benefiting from safer roads, current drivers would see a modest decrease in their annual auto insurance premiums. With more licensed drivers will come more registered vehicles; for people purchasing auto insurance in Michigan, the cost of insurance would decrease. In addition, the average auto insurance costs are lower in states that allow undocumented immigrants the ability to obtain driver’s licenses compared with states that do not.10 One robust model analyzed over a decade’s worth of data across states and determined that on average, in states that lifted restrictions on driver’s licenses for undocumented immigrants, all drivers’ annual cost of insurance decreased by $20.11
Everyday Impact
Allowing the 110,000 Michigan residents who cannot prove their legal presence to apply for a driver’s license will undoubtedly make daily tasks easier and safer for those who do obtain one. These activities include getting groceries, visiting family members in the hospital, taking children to receive a vaccination, driving to church and leasing business space. Access to state-issued identification means that undocumented Michigan residents can regularly participate in our state economy more fully. Restricting opportunity to travel easily not only changes individuals’ and families’ driving habits by narrowing their radius of travel but also restricts their ability to shop locally and contribute to the state economy.12
Local Economy
Michigan’s $100 billion agricultural industry benefits greatly from immigrants, including migrant farm workers. In fact, 20% of all Michigan workers in farming, fishing and forestry are immigrants.13 An estimated 5% of undocumented laborers in Michigan are working in these occupations.14 It is not surprising that because of this representation and the need for all employees to get to and from work easily and safely, the Michigan Farm Bureau supports the state allowing access to driver’s licenses for undocumented immigrants.15 Additionally, access to a driver’s license affects the amount of money Michiganders earn and spend. When people can more easily get to and from their jobs, they are able to work more hours and earn more money. With improved mobility among workers, the labor market would function more smoothly because employees would be able to more easily find jobs—including higher-paying ones that better match their skills—and employers would have a larger pool of applicants to choose from when filling positions.16 Furthermore, those without driver’s licenses may be limited in both the regions in which they shop (primarily near home or work, e.g.) and purchases that require identification, such as new vehicles, medication, alcohol or cigarettes. On the other hand, residents with driver’s licenses will likely broaden the range of businesses they buy from and increase the amount of money spent locally in Michigan.
Methodology
Number of undocumented immigrants of driving age and the number who would obtain a driver’s license during the first three years of implementation
Before narrowing to the number of undocumented immigrants of legal driving age, we begin with the weighted average of two estimates of the total number of undocumented immigrants in Michigan from the Center on Migration Studies17 (CMS) and the Pew Research Center.18 The weights applied are based on what percentage of the total Michigan population (9,995,915 in 2018 as reported by the U.S. Census Bureau) is undocumented according to these two estimates. The CMS estimate uses microdata from the Integrated Public Use Microdata Series (IPUMS) that is reported through the 2017 American Community Survey (ACS) and is recognized as a reliable estimate of local-level data. The Pew estimate is 2017 data based on augmented U.S. Census Bureau data. Our weighted average was 115,590 people.
To estimate the total number of undocumented immigrants who are eligible for a driver’s license because they are 16 years old or older, we first estimate the percentage of the total undocumented population in Michigan who are in this age range. Based on CMS’ estimate for the number of undocumented immigrants who are 16 years or older (108,978)—legal driving age in Michigan—we calculated the percent of the undocumented population in this range in both the CMS and Pew data. We use the weighted average of these two percentages to obtain our final estimate that 94.48% of 115,590 undocumented immigrants are over the age of 16. This results in 109,211 undocumented immigrants who are residents of Michigan and are of driving age.
We estimate a 50% take-up rate for driver’s licenses among undocumented immigrants in Michigan within the first three years of implementation, resulting in 54,606 new driver’s licenses issued during this timeframe. This take-up rate is based on the experiences of other states that have passed legislation to allow undocumented immigrants to obtain driver’s licenses,19 estimates from other states on driver’s license take-up and data on Michigan drivers. After two full years of implementation, three out of five states reporting saw between 34% and 40% take-up (34% in California, 36% in Washington, D.C., and 40% in Illinois). Of states that had reported a full three years of implementation, Nevada, which had low take-up rates across all three years, saw 25% take-up and Illinois saw a jump to 47% take-up. Based on these take-up rates, the Fiscal Policy Institute in New York conducted a robust fiscal analysis on the impact of lifting restrictions on driver’s licenses using an estimated 50% take-up.20
We compare Michigan data with that of Illinois and New York in particular to establish our take-up rate. All of these states have a high number of lane-miles, or miles of roads that are intended for driving. This is evidenced by the estimated lane-miles in each state as reported by the Federal Highway Administration in 2018: out of all states, Illinois ranks third (307,000 miles) and New York ranks 12th (239,000 miles); Michigan ranks between those states at 10th with 256,000 miles.21 This is not surprising given much of these states is made up of rural area and farmland, and would require a vehicle to access.
Although Michigan may be similar to Illinois and New York in terms of lane-mileage, the availability of public transportation will influence how many residents use cars and apply for a driver’s license. Both Illinois and New York have extensive public transportation systems in Chicago and New York City, respectively, which is something Michigan lacks. Yet, this availability did not impede the three-year take-up rate in Illinois (nor did it in appear to in Washington, D.C., which is entirely urban and whose transit system is also notably robust). The New York analysis notes that 57% of New York City adults do have a driver’s license, which is taken into account when establishing their estimated 50% take-up rate. Because Michigan does not have as extensive a public transportation system as Illinois, Washington, D.C., or New York, we would expect that the take-up rate for driver’s licenses would be higher in Michigan given that access to an alternative form of transportation is not as much a limiting factor.
Finally, the proportion of current adult drivers in a state provides context for the utility in having, and interest in obtaining, a driver’s license. Based on data from the Federal Highway Administration and the U.S. Census Bureau, 79% of adult residents in New York have a driver’s license and 86% of adults in Illinois do; in Michigan, this number is 91%. A higher proportion of adults currently driving in Michigan compared with Illinois and New York is another reason that we would expect our take-up rate for driver’s licenses among the undocumented community to be a conservative estimate that is comparable to that of the higher end of the observable three-year data.
Number of new cars on the road
To project the number of new cars purchased and registered in Michigan, we assume 36.6% of those who obtain driver’s licenses would purchase a car.22 This percentage is based on the Fiscal Policy Institute in New York’s analysis of CMS IPUMS data (2010-2013), which looks at vehicle ownership in other immigrant households.20 This analysis assumes that given access to driver’s licenses, undocumented immigrants would purchase vehicles at the same rate when also taking into account household income. Applying this percentage to the number of additional licenses expected in the first three years of implementation projects 19,986 newly registered vehicles in this timeframe.
Revenue estimates
As is outlined in the table below, projected revenue over the course of 10 years post-implementation would include fees from additional driver’s licenses (and renewals), vehicle registrations (and renewals), vehicle titles, vehicle license plates, and sales and gas taxes related to vehicle use. As noted in the report, sales tax here includes that which is applied to motor vehicles and parts, but not that which is applied to other purchases made by new drivers that would also be subject to sales tax. These would likely increase with greater mobility and higher wages. Any additional assumptions are included below.
Revenue from the first three years of implementation
All Michigan driver’s licenses are initially $25; we multiplied this amount by the projected number of additional licenses issued. We also multiplied the fees for a vehicle title ($15), standard license plate ($5) and average vehicle registration (which is estimated at $135 by the Michigan Department of Transportation23) by the projected number of additional vehicles purchased in the first three years of implementation.
Additional revenue from sales and gas-related taxes (i.e., gas tax and sales tax on gas) are estimated using individual-level consumption data. Based on 2018 Bureau of Economic Analysis (BEA) total per capita personal consumption expenditures in the state of Michigan, residents spend $1,299 per year on motor vehicles and parts (defined as “purchases of new motor vehicles, net purchases of used motor vehicles, and purchases of motor vehicle parts and accessories”).24
It is important that we consider income in this part of our analysis, as well. Based on the CMS 2017 IPUMS data, an estimated 23.5% of undocumented immigrants in Michigan have an income that is at or below the federal poverty level ($12,140 for a single adult). To examine vehicle-related purchases and consumption by income and determine whether consumers with lower incomes spend substantially less on vehicles than is captured in the BEA estimate, we use the 2018 Consumer Expenditure Survey, which provides data on expenditures, income and demographic characteristics of consumers in the United States.25 Based on the survey data, those who earned $11,695 after taxes (income in the lowest 20% for survey respondents) spent an average of $1,253 on vehicle purchases. Because this amount is so similar to the Michigan-specific BEA estimate, we multiply the BEA estimate of $1,299 in annual expenditure by the projected number of new vehicles purchased and apply the 6% sales tax. Note this does not include any specific “check engine repairs” as sales tax is not paid on labor in Michigan, and parts are included in the BEA estimate.
Our analysis of gas-related taxes assumes the additional 20,000 cars that are registered were built in the last decade. The Corporate Average Fuel Economy (CAFE) standard for new vehicles is reported by the Bureau of Transportation Statistics in miles per gallon (mpg).26 The average mpg, taking into account both passenger cars and light trucks, from 2009 to 2016 (most recent data) is 28.9 mpg. (Note that if the cars purchased are older, this average mpg would decrease, in turn raising projected expenditure on gas and increasing related revenue; if newer, the reverse.) The Federal Highway Administration estimates that the average driver drives 13,500 miles per year.27 These numbers give us 467.13 gallons per year in gas consumption for the average vehicle made from 2009-2016. Using a point-in-time estimate based on the average prices in November 2019, we assume the price of gas is $2.50 per gallon and the average driver will spend $1,167.82 on gas per year. Applying Michigan’s 26.3 cent-per-gallon gas tax, the average driver will contribute $307.14 in taxes on gas to the state of Michigan per year. By multiplying this amount by the projected number of new vehicles purchased, we obtain our estimated increase in gas taxes over the first three years of implementation. To obtain an annual amount of sales tax on gas per average driver, we multiply the amount spent on gas per year per consumer by 6% sales tax ($70.07). We multiply this amount by the projected number of new vehicles purchased to obtain the estimated additional sales tax revenue from gas purchases in the first three years of implementation.
Revenue compared to additional costs
To keep up with an increase in the number of Michigan residents who seek to obtain driver’s licenses and register vehicles, the Secretary of State will be required to increase its staff and provide training across the state. There are a number of states whose experiences we can draw from in estimating these costs. For example, Maryland projected 230,000 new licenses would be issued over a four-year period, requiring 10 permanent and 55 temporary staff, and estimated its costs at $8.8 million. Illinois projected it would issue from 250,000 to 1 million new licenses, hire 100 people (including call operators for appointments) and require $800,000 in the first year and $250,000 annually thereafter.28 Based on the estimated number of new licenses that would be issued in Michigan—55,000, or approximately one quarter of what Maryland and Illinois predicted—the projected revenue would easily compensate for any additional costs, including staffing, outreach and translation services.
Annual revenue and 10-year estimate
Driver’s licenses must be renewed every four years in Michigan, at $18 per renewal. As it is likely that most of those who obtained a driver’s license in the first three years of implementation will have renewed their license twice in 10 years, our 10-year estimate assumes that the all of the 55,000 newly licensed Michiganders have done so (just under $2 million in renewal fees). Fees for vehicle titles and standard license plates are paid once.
Vehicles must be registered in Michigan annually. We assume the same vehicle registration cost at $135 and that all drivers are again registering their vehicles. Note this does not take into account any additional vehicles that these drivers may register in any given year. Sales tax and gas-related taxes (see Revenue from the first three years of implementation, above) are annual sources of revenue and these numbers are reflected as such in the table below.

Endnotes
- Michigan Legislature, Senate, SB 631, introduced November 5, 2019, http://www.legislature.mi.gov/documents/2019-2020/billintroduced/Senate/pdf/2019-SIB-0631.pdf.
- Along with the District of Columbia and Puerto Rico, 14 states already provide access to a driver’s license or state identification card. These include: California, Colorado, Connecticut, Delaware, Hawaii, Illinois, Maryland, Nevada, New Mexico, New York, Oregon, Utah, Vermont and Washington.
- Attorney General Mike Cox, “Permanent Residency Requirement for Driver’s Licenses, Opinion No. 7210,” Michigan Department of the Attorney General, December 7, 2007, https://www.ag.state.mi.us/opinion/datafiles/2000s/op10286.htm.
- See Methodology for information regarding costs of implementation.
- See Methodology for data sources and estimates of the number of undocumented immigrants, uptake of licenses and vehicles and revenue generated from driver’s licenses, car registration, sales tax and gas tax.
- “Unlicensed to Kill,” AAA Foundation for Traffic Safety, November 2011, https://www.adtsea.org/webfiles/fnitools/documents/aaa-unlicensed-to-kill.pdf.
- Kara E. MacLeod et al., “Factors associated with hit-and-run pedestrian fatalities and driver identification,” Accident Analysis & Prevention 45 (2012), https://doi.org/10.1016/j.aap.2011.08.001.
- J. Alejandro Tirado-Alcaraz, “Issuing Driver’s Licenses to Undocumented Immigrants in Rhode Island: Policy Analysis,” p. 21, Latino Policy Institute at Roger Williams University, June 2016, https://www.rwu.edu/sites/default/files/downloads/lpi/drivers-license_report-legal.pdf. Using a regression analysis, the author identifies a statistically significant correlation between the percentage of undocumented immigrants in a state and the number of traffic fatalities—states with more undocumented immigrants saw fewer traffic fatalities. Further, after stratifying states by whether or not they allow undocumented immigrants to obtain a driving document (a driver’s license, e.g.), the study finds fewer traffic fatalities, on average, among states that do not restrict driving documentation based on immigration status compared with states requiring either documented legal presence or a valid SSN.
- A. J. Benson et al., “Hit-and-Run Crashes: Prevalence, Contributing Factors, and Countermeasures,” AAA Foundation for Traffic Safety, 2017, https://aaafoundation.org/wp-content/uploads/2018/04/18-0058_Hit-and-Run-Brief_FINALv2.pdf.
- J. Alejandro Tirado-Alcaraz, “Issuing Driver’s Licenses to Undocumented Immigrants in Rhode Island: Policy Analysis,” p. 20, Latino Policy Institute at Roger Williams University, June 2016, https://www.rwu.edu/sites/default/files/downloads/lpi/drivers-license_report-legal.pdf. The author demonstrates a statistically significant correlation between the percentage of undocumented immigrants and the average auto insurance costs for states with restrictions and states without.
- Mauricio Cáceres and Kenneth P. Jameson, “The effects on insurance costs of restricting undocumented immigrants’ access to driver licenses,” Southern Economic Journal 81, no. 4 (2015), https://doi.org/10.1002/soej.12022. This savings is statistically significant and this estimate is adjusted for inflation from $2009 to $2019.
- Mary C. King, “Assessment of the Socio-economic Impacts of SB 1080 on Immigrant Groups,” Oregon Department of Transportation, June 2011, https://www.oregon.gov/ODOT/Programs/ResearchDocuments/SB1080.pdf.
- Analysis of the U.S. Census Bureau’s 2015 American Community Survey 1-year PUMS data by the American Immigration Council, October 13, 2017, https://www.americanimmigrationcouncil.org/research/immigrants-in-michigan.
- Based on Center for Migration Studies estimates derived from the U.S. Census Bureau’s 2017 American Community Survey 1-year PUMS data, accessed November 8, 2019, http://data.cmsny.org/state.html.
- “Policy & Politics: Limited Purpose Operator’s License #100,” Michigan Farm Bureau, accessed November 8, 2019, https://www.michfb.com/MI/Policy_and_Politics/Policies/Transportation/Limited_Purpose_Operators_License/. This policy can also be found in the Michigan Farm Bureau 2019 Policy Book, accessible here: https://www.michfb.com/MI/uploadedFiles/Content/Policy_and_Politics/Farm_Bureau_Policy/2019%20POLICY%20BOOK%20-%20Digital.pdf.
- Sarah E. Hendricks, “Living in Car Culture Without a License,” American Immigration Council, April 2014, https://www.americanimmigrationcouncil.org/sites/default/files/research/living_in_car_culture_without_a_license_3.pdf.
- “State-Level Unauthorized Population and Eligible-to-Naturalize Estimates,” Center for Migration Studies, Accessed September 25, 2019, http://data.cmsny.org/state.html.
- “Unauthorized immigrant population trends for states, birth countries and regions,” Pew Research Center: Hispanic Trends, June 12, 2019, https://www.pewresearch.org/hispanic/interactives/unauthorized-trends/.
- David Dyssegaard Kallick and Cyierra Roldan, “Take-Up Rates for Driver’s Licenses: When Unauthorized Immigrants Can Get a License, How Many Do?” Fiscal Policy Institute, January 31, 2017, http://fiscalpolicy.org/wp-content/uploads/2017/01/FPI-Brief-on-Driver-Licenses-2017.pdf.
- David Dyssegaard Kallick and Cyierra Roldan, “Expanding Access to Driver’s Licenses: Getting a License Without Regard to Immigration Status, Fiscal Policy Institute, January 31, 2017, http://fiscalpolicy.org/wp-content/uploads/2017/01/FINAL-Drivers-licenses-report-2017.pdf.
- “Highway Statistics 2017: Estimated Lane Miles,” Federal Highway Administration, August 23, 2018, https://www.fhwa.dot.gov/policyinformation/statistics/2017/hm48.cfm.
- Note that new cars means new vehicle purchases, not necessarily a new vehicle model.
- “Fast Facts 2019,” Michigan Department of Transportation, February 2019, https://www.michigan.gov/documents/mdot/MDOT_fastfacts02-2011_345554_7.pdf.
- “Consumer Spending by State: Personal Consumption Expenditure by State, 2018,” Bureau of Economic Analysis, October 3, 2019, https://www.bea.gov/data/consumer-spending/state.
- “Quintiles of income before taxes: Annual expenditure means, shares, standard errors, and coefficients of variation,” Consumer Expenditure Survey, 2018, September 2019, https://www.bls.gov/cex/2018/combined/quintile.pdf.
- “Average Fuel Efficiency of U.S. Light Duty Vehicles [Table],” Bureau of Transportation Statistics, May 2018, https://www.bts.gov/content/average-fuel-efficiency-us-light-duty-vehicles.
- “Average Annual Miles per Driver by Age Group,” Federal Highway Administration, March 29, 2018, https://www.fhwa.dot.gov/ohim/onh00/bar8.htm.
- “Deciding Who Drives,” Pew Charitable Trusts, August 2015, https://www.pewtrusts.org/-/media/assets/2015/08/deciding-who-drives.pdf. Both Maryland and Illinois currently allow residents to obtain driver’s licenses, regardless of whether they can demonstrate legal presence.

 Betsy Zobl-Tar
  Jay Cutler joined the League in March 2026 as the Kids Count Senior Data Analyst, where he collects, analyzes, and prepares data for Kids Count in Michigan.
 Danielle Taylor-Basemore joined the League as the Development Data and Stewardship Coordinator in June 2025. She brings with her five years of nonprofit experience with a special focus on community engagement, data visualization and strategic programming. Prior to joining the League, Danielle served as the Business District, Safety, and Digital Manager at Jefferson East, Inc.
 Scott Preston is a Senior Policy Analyst with the Michigan League for Public Policy, where he leads the organization’s immigration and criminal justice reform portfolios. In the three years prior to joining the League, Scott facilitated the Southeast Michigan Refugee Collaborative and managed a small business economic development program at Global Detroit. His work included launching Michigan’s first Refugee Film Festival and building on a trusted connector model that linked marginalized communities with crucial resources. Scott’s work at the League is informed by his background in journalism and research. He spent four years covering the Syrian refugee crisis in the Middle East for publications such as The Economist, and later worked with unaccompanied refugee minors through Samaritas. Scott holds a master’s degree in international migration and public policy from the London School of Economics and Political Science.
 Kate Powers joined the League as the Chief Development Officer in February 2025. Prior to joining the League, Kate held leadership positions at many Michigan nonprofit organizations, most recently serving as the COO and Chief Development Officer of Ele’s Place. Kate has spent the bulk of her career in fundraising, with a short stint in the state Legislature as a legislative aide to members in both chambers. Kate is a graduate of Michigan State University’s James Madison College with a Bachelor of Arts in Social Relations and has a certificate in fundraising management from the Lilly Family School of Philanthropy at Indiana University. Additionally, Kate served on the East Lansing Public Schools Board of Education and is a past President of the Junior League of Lansing. In her free time, she enjoys traveling with her husband and her son and saving outfit of the day and home decor ideas on Pinterest.
  Nicholas Hess joined the League as the Fiscal Policy Analyst in September of 2024. In this role, Nicholas focuses on tax policy, government revenue, and their impact on working families and racial equity, including the effects of the Earned Income Tax Credit (EITC) and Child Tax Credit (CTC). Nicholas values the role that judicious fiscal policy can play in the improvement of people’s lives and the economy, alleviating inequities along the way.
 Audrey Matusz joined the League as the Visual Communications Specialist in September 2024. She supports the team with implementing social media strategies and brainstorming creative ways to talk about public policy. She brings with her nearly a decade of experience in producing digital products for evidence-based social justice initiatives.
  Jacob Kaplan
  Donald Stuckey
  Alexandra Stamm
 Amari Fuller
 Mikell Frey is a communications professional with a passion for using the art of storytelling to positively impact lives. She strongly believes that positive social change can be inspired by the sharing of data-driven information coupled with the unique perspectives of people from all walks of life across Michigan, especially those who have faced extraordinary barriers.


 Yona Isaacs (she/hers) is an Early Childhood Data Analyst for the Kids Count project. After earning her Bachelor of Science in Biopsychology, Cognition, and Neuroscience at the University of Michigan, she began her career as a research coordinator in pediatric psychiatry using data to understand the impacts of brain activity and genetics on children’s behavior and mental health symptoms. This work prompted an interest in exploring social determinants of health and the role of policy in promoting equitable opportunities for all children, families, and communities. She returned to the University of Michigan to complete her Masters in Social Work focused on Social Policy and Evaluation, during which she interned with the ACLU of Michigan’s policy and legislative team and assisted local nonprofit organizations in creating data and evaluation metrics. She currently serves as a coordinator for the Michigan Center for Youth Justice on a project aiming to increase placement options and enhance cultural competency within the juvenile justice system for LGBTQIA+ youth. Yona is eager to put her data skills to work at the League in support of data-driven policies that advocate for equitable access to healthcare, education, economic security, and opportunity for 0-5 year old children. In her free time, she enjoys tackling DIY house projects and trying new outdoor activities with her dog.
 Rachel Richards rejoined the League in December 2020 as the Fiscal Policy Director working on state budget and tax policies. Prior to returning to the League, she served as the Director of Legislative Affairs for the Michigan Department of Treasury, the tax policy analyst and Legislative Director for the Michigan League for Public Policy, and a policy analyst and the Appropriations Coordinator for the Democratic Caucus of the Michigan House of Representatives. She brings with her over a decade of experience in policies focused on economic opportunity, including workforce issues, tax, and state budget.
 Simon Marshall-Shah joined the Michigan League for Public Policy as a State Policy Fellow in August 2019. His work focuses on state policy as it relates to the budget, immigration, health care and other League policy priorities. Before joining the League, he worked in Washington, D.C. at the Association for Community Affiliated Plans (ACAP), providing federal policy and advocacy support to nonprofit, Medicaid health plans (Safety Net Health Plans) related to the ACA Marketplaces as well as Quality & Operations.

 Renell Weathers, Michigan League for Public Policy (MLPP) Community Engagement Consultant. As community engagement consultant, Renell works with organizations throughout the state in connecting the impact of budget and tax policies to their communities. She is motivated by the belief that all children and adults deserve the opportunity to achieve their dreams regardless of race, ethnicity, religion or economic class.


 Emily Jorgensen joined the Michigan League for Public Policy in July 2019. She deeply cares about the well-being of individuals and families and has a great love for Michigan. She is grateful that her position at the League enables her to combine these passions and work to help promote policies that will lead to better opportunities and security for all Michiganders.
 Megan Farnsworth joined the League’s staff in December 2022 as Executive Assistant. Megan is driven by work that is personally fulfilling, and feels honored to help support the work of an organization that pushes for more robust programming and opportunities for the residents of our state. She’s excited and motivated to gain overarching knowledge of the policies and agendas that the League supports.


